Aurora
Astrospheric displays several Aurora-related datasets to aid in determining when and where an Aurora will be visible.
The forecasted Kp index is available on the hourly forecast as well as the extended cloud forecast.
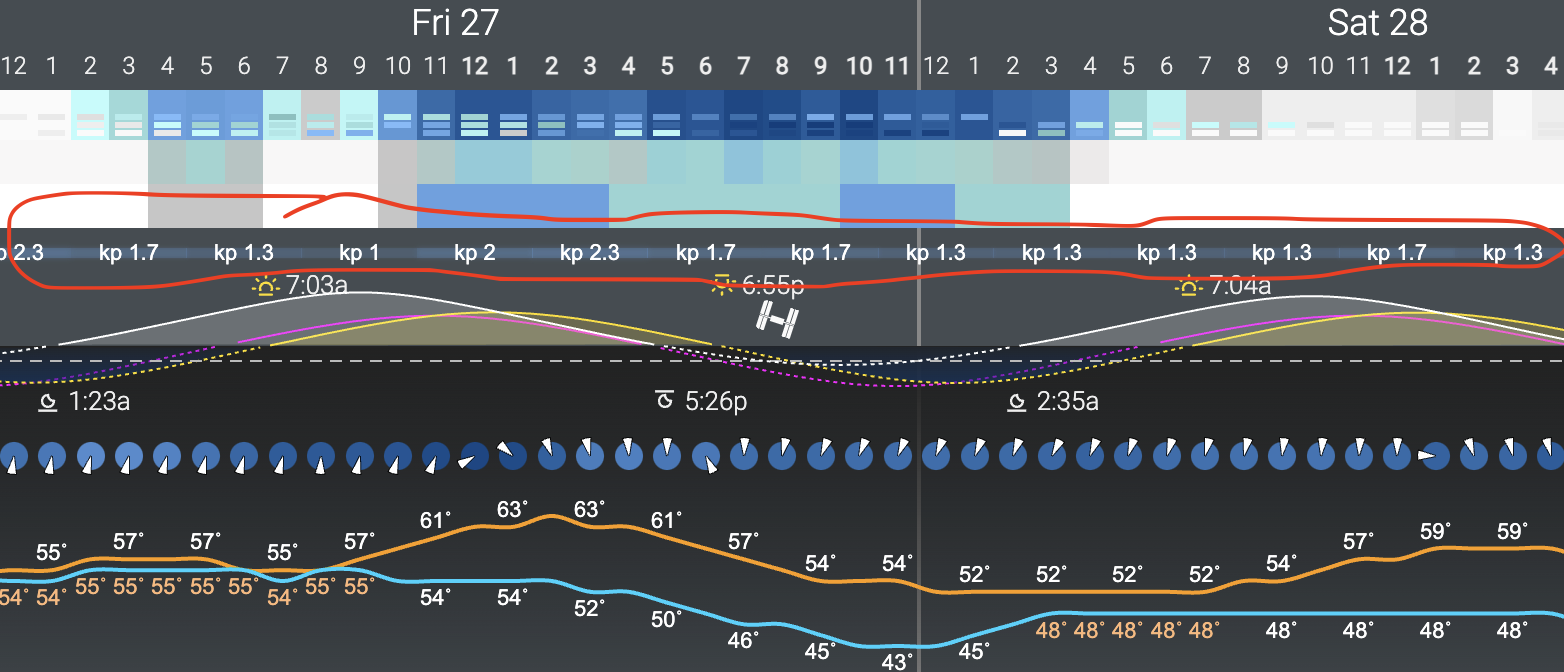
The Kp index measures geomagnetic activity on a scale from 0 to 9, where higher numbers indicate stronger disturbances in the Earth's magnetic field. For aurora viewing, a Kp index of 5 or higher usually suggests auroral activity could be visible at mid-latitudes. Lower values indicate auroras are more likely confined to higher latitudes, closer to the poles. Use the Kp index to determine when an aurora may be visible in your region, especially in conjunction with clear skies.
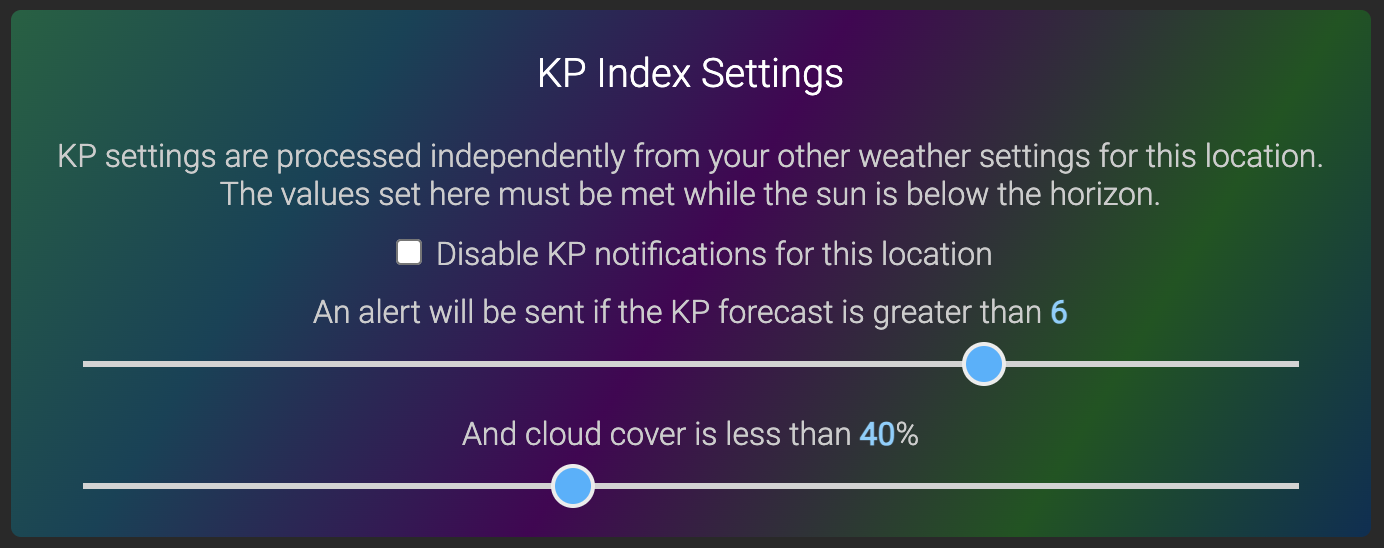
Astrospheric Pro members can set weather alerts to pinpoint specific upcoming Kp and cloud cover conditions.
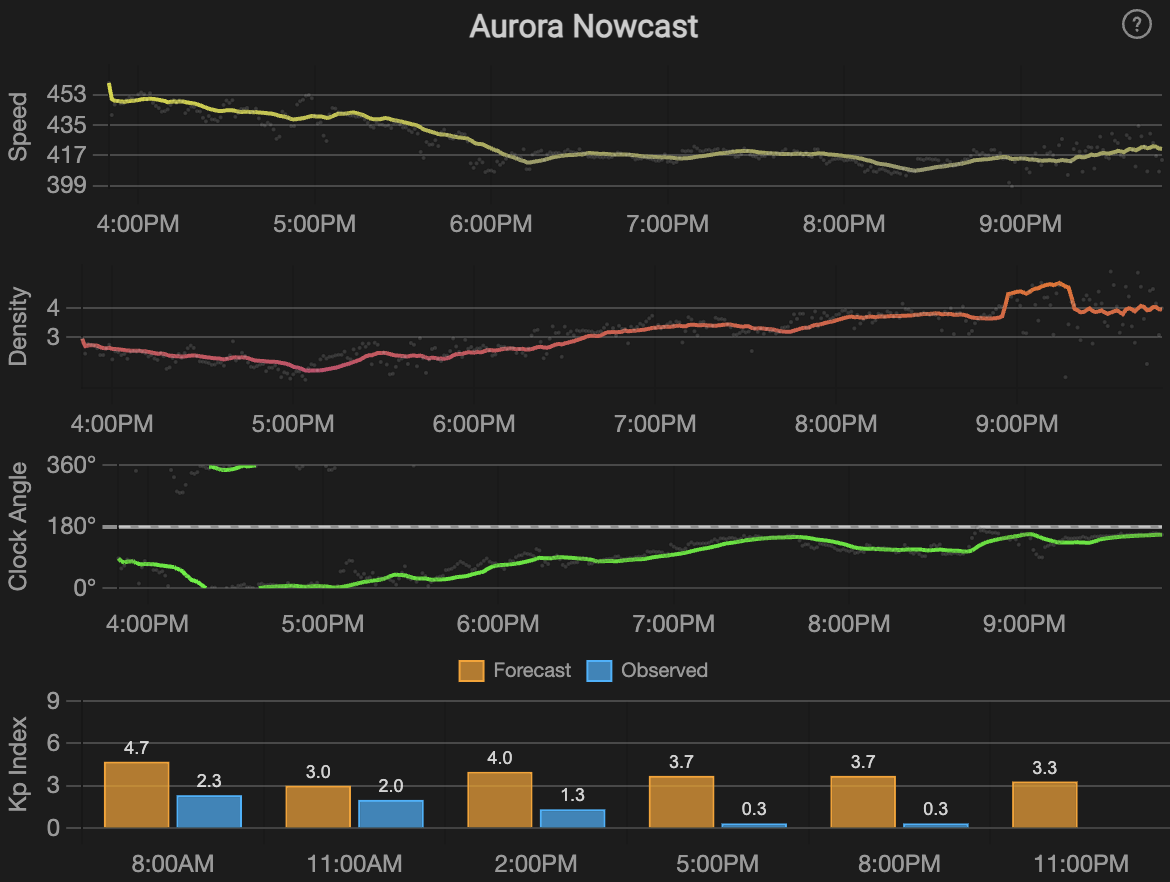
The Aurora data card shows short-term Aurora datasets. These datasets are updated in near real-time and help with short-term planning.
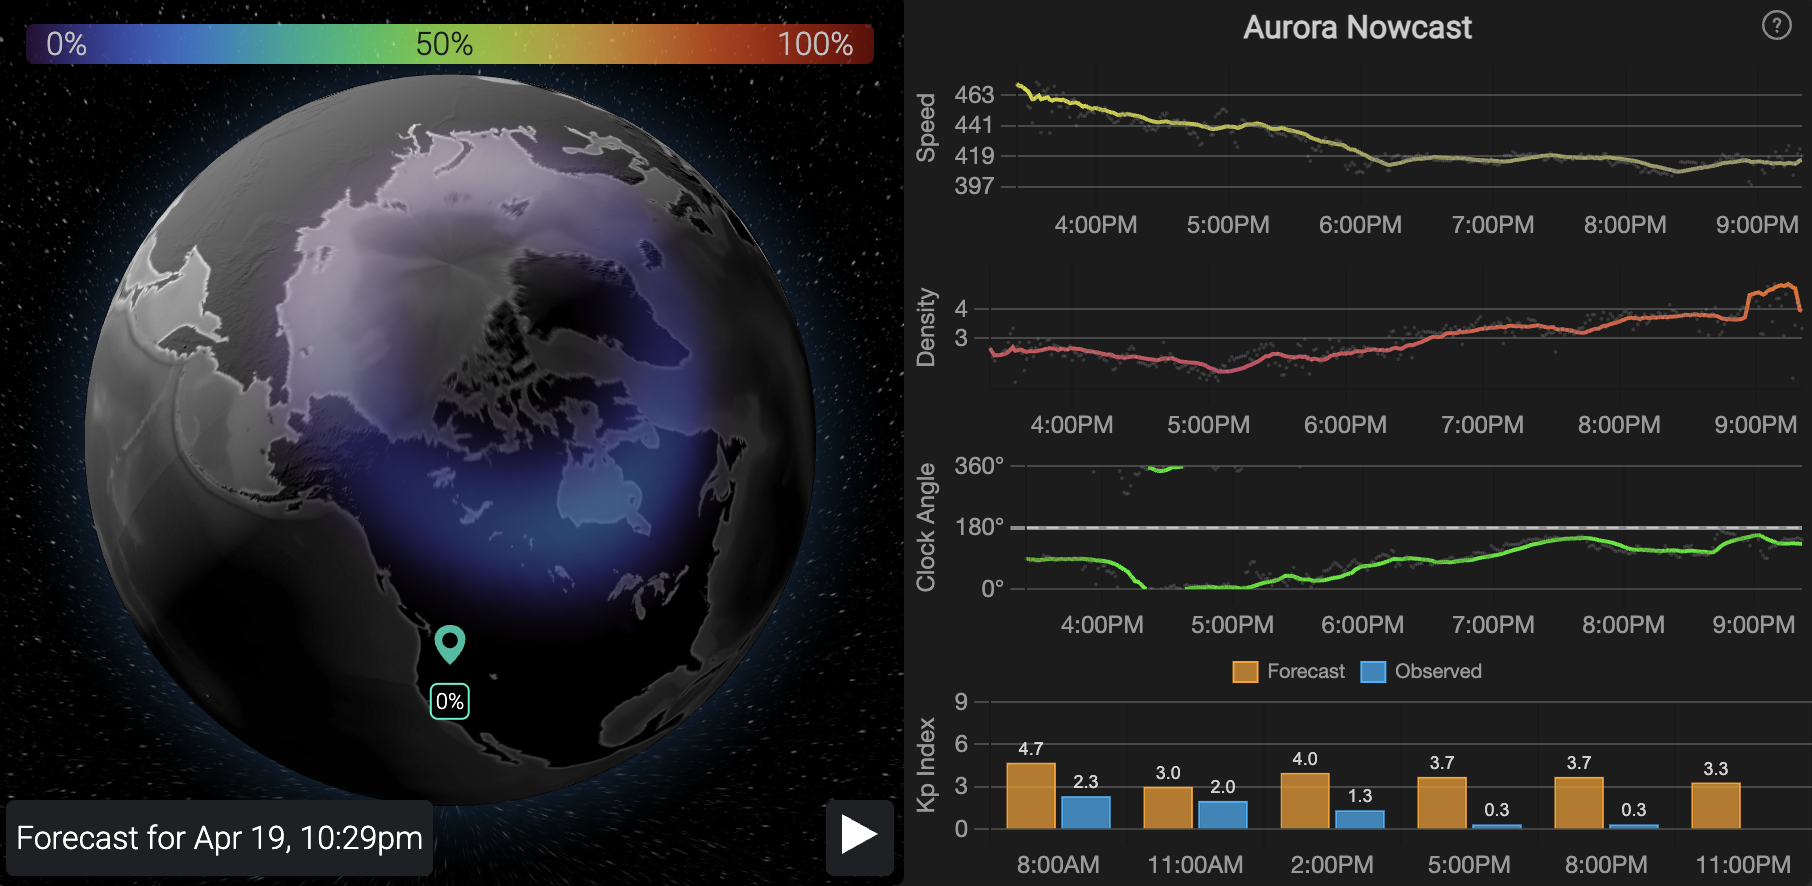
The 3D globe displays the current Ovation visual. This shows a predicted likelihood of an aurora being visible as a percentage for a given location. The Ovation visual is updated every 5 minutes, and pressing play will display the last few hours of data.
The Aurora data card also displays critical solar wind parameters that influence auroral activity: speed, density, and Bz (GSM). The graphs for each of these values are updated in near real-time and show trends over time, with a line representing the running average of the last 10 data points.
- Solar wind speed: Faster solar wind usually means a better chance for auroras. When speeds rise above about 500 km/s, aurora activity becomes more likely, especially if other conditions also line up.
- Density: Density tells you how much solar material is hitting Earth’s magnetic field. Higher density can help strengthen auroras, especially when combined with fast solar wind and favorable magnetic conditions.
- Clock angle: This shows the direction of the solar wind magnetic field using the By and Bz components. When the line is near 180°, the magnetic field is pointed southward, which allows it to connect more easily with Earth’s magnetic field. The color shows the strength of that field. A redder line means a longer magnetic field vector (stronger combined By and Bz). When the line is both near 180° and red, it means strong coupling is likely, which increases the chance of auroras. The line may sometimes jump from the top of the graph to the bottom (or vice versa) when it wraps from 360° to 0°. This is normal.
- Forecast Kp index vs. Observed Kp index: This graph compares the predicted Kp index with the Kp index being measured around the world. Kp is a simple scale that shows how disturbed Earth’s magnetic field is. Higher Kp values usually mean stronger geomagnetic activity and a better chance of seeing auroras farther from the poles. Comparing forecast and observed Kp helps show whether current conditions are matching the prediction.